Showing posts with label NOL. Show all posts

Friday, April 8, 2011

NOL : Out of downtrend ?


Today NOL closed at 1.99 with good volume of 27 m shares traded. Prices touched a high of 2.01 which was again not sustained into the close..

Things seem to be brightening up for NOL as it seems to have moved out of the downtrend channel and into a slight uptrend(see chart). Also it managed to close above the 20MA. Sustained closes above 20MA would indicate that the trend is indeed changing. Important resistance is at 2.02 as this level was tested unsucessfully several times in the past. If 2.02 is taken out, 2.10 will be a possible target. Immediate support is at 1.94, However STI is currently overbought and I think the price is likely to see consolidation for a few sessions before moving higher.

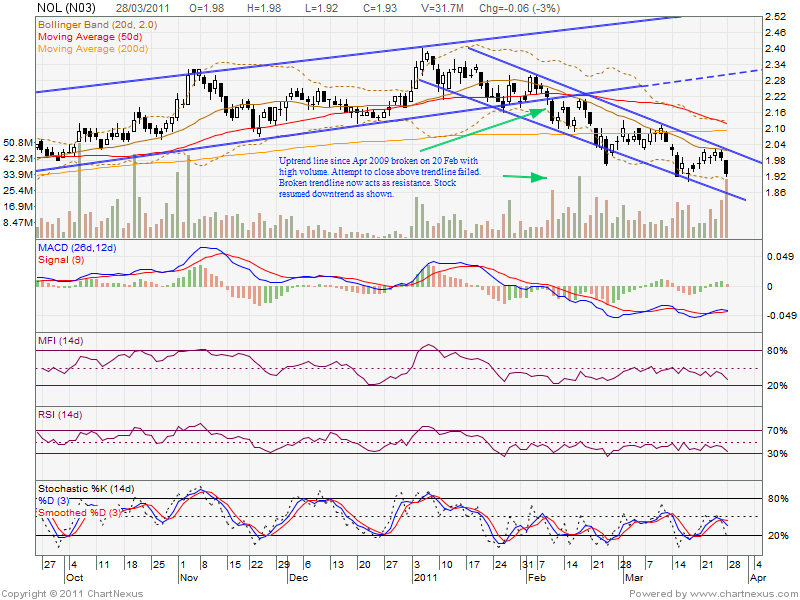
I also noted that the Bollinger bands are tightening, indicating that a large move is near.

Why I bought NOL at 1.93 last Friday?

1) Gentler slope of downtrend indicating that selling pressure is easing

2) Slight positive Macd /RSI/Stochastic divergence as seen in the chart. Prices made a new low but Macd/RSI/Stochastics edged up.

3) Strong support at 1.87-1.92 region (Aug 2010 low, Fibonacci support)

All these factors indicated that the downside is minimal and so I took a small position.

Watch the next few sessions. It will be a good sign if the price can maintain above 20MA and 1.92 is not broken.

Monday, March 28, 2011

NOL: Still in downtrend


NOL's price has been constantly weighed down by high oil prices and closed at 1.93 on high volume of 31.7 m shares today.


First take a look at NOL's long-term chart. The stock was in a steady uptrend since Apr 2009, after which it broke its uptrend on 20 Feb ( see next chart) and failed to close above it. After this trendline was broken, NOL started falling more rapidly. In fact it had already been in a downtrend since 5 Jan when it peaked at 2.40, forming a series of lower highs and lower lows but the broken uptrend further confirms this and makes it more bearish. NOL has also been continuously under its 20 day MA, which is falling with the 50 day MA, confirming the downtrend. This counter looks more like a candidate for going short although even for bearish stocks there are still opportunities for going long. The green line shows the 1.90 level which is quite an important support level.


Important support: 1.89-1.90 (24 Aug 2010 low, 38.2% retracement from 2.40-1.04) , 1.75 (May 25 2010 low)
Important resistance : 1.98, 2.02

MACD and RSI are still trending down which is bearish. The price has also failed to close above the 20 day MA indicating that the trend is still down

NOL is trending downward and the upper downtrend line at 2.01 is also acting as resistance as NOL always experiences profit taking around that level and it also made a large move lower today on high volume. Price is also below the 50 day MA and 200 day MA at 2.12 and 2.08 respectively.

Strategy: Possibly buy around 1.90 which is near several important support levels and near channel bottom. For a downtrending stock, buying at top of channel is a strict no-no. Take partial/full profits at top of channel. Buy on breakout of downtrend channel if accompanied with high volume, preferrably after sustained closes above 20 day MA showing that trend has reversed.

I usually prefer to buy strong uptrending counters on temporary weakness than buy weak counters on breakout as it could be a fake breakout.

STI is finally taking a pause today after 5 straight up days last week. I am pleased to have taken profits on CityDev at 11.72 on Friday.